Data visualisation tips
Data visualisation is the method of presenting data through visual aids such as graphs, diagrams, and dashboards. The purpose of this is to make complex information easier to interpret and use. Good data visualisation helps people quickly understand the trends, patterns, or problems of a dataset.
Data visualisation considerations
Consider data, audience and the tools
Before you start creating a visualisation of your data, it’s a good idea to invest some time in understanding what your metrics mean. This means checking :
- what each column or number represents
- where the data comes from
- any limitations the data may have.
If you don’t understand what your data is telling you, it’s unlikely that your audience will understand.
It’s important to first think about who will be using the visualisation and why they are looking at it.
Building a visualisation with the needs of your audience in mind is important because their needs will affect the kind of visuals they find most helpful.
Asking for feedback early in the development phase of a prototype is a great way to make sure you stay on track. Keep in mind that different versions may need to be created for different groups.
A strong visual needs reliable data behind it. Invest time in cleaning your dataset before you start work on a visualisation.
Cleaning your dataset includes:
- checking for errors, including duplicates
- checking for missing values
- checking data types and making sure you are using the correct one.
Remember, clean and accurate data leads to reliable visualisations.
There are many tools available to design and deploy your visualisation such as Tableau, DOMO, Data Studio, R Studio, Power BI, Python. Each tool has their own pros and cons.
Ultimately, the technology you choose will be dependent on your specific data and audience.
Before deciding on a tool, map out how the tool will connect to your data and how it will be updated and shared in time. This will help to safeguard against wasting time, and licensing fees in some cases, on technology that is not fit for your purpose.
Design considerations
Tips to help you refine your data visualisation.
Consider the following elements to help deliver your message with clarity:
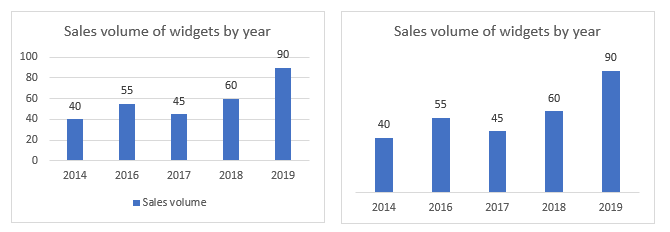
- grid lines
- data labels
- chart title should contain all the required information
- legends are helpful when you have more than one variable.
The graphics below show how it is possible to improve the readability of a chart simply by removing unnecessary chart elements.

Consider the following guidelines on the use of colour:
- The default chart background should be white as it ensures high contrast between the chart elements.
- Check that the chart makes sense when it is printed in black and white.
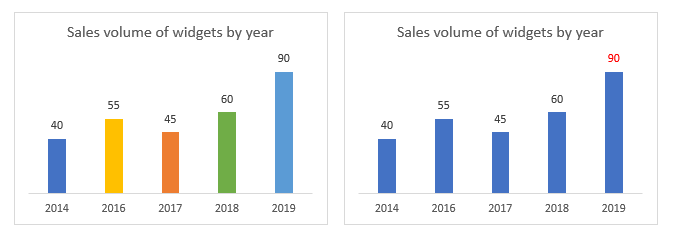
- Use colours sparingly and deliberately. Use only for visual hierarchy or to denote meaning. Take into account colour connotations.
- Use colours consistently if assigning meaning to a colour in your charts.
- Use the red colour to accentuate a specific point.
The graphics below shows that colours on the visualisation don’t add anything. By limiting the colours used, the increase in sales of widgets in 2019 stands out.

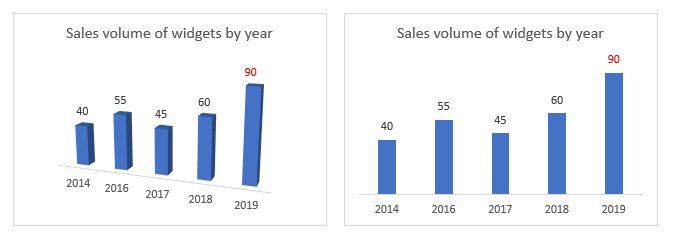
3D graphs are awful when the data does not support it. If it can accurately be presented in 2D form, do it in 2D. And if you need the third dimension, use it wisely.
