Data.NSW is the NSW Government’s open data portal. Data from other open data portals, such as the Department of Planning, Industry and Environment’s (DPIE) SEED Portal can be searched for via Data.NSW. In this data story, we share DPIE’s work to collect data on water quality following the 2019-2020 bushfires and release it as open data making it available to the community, informing planning and promoting research.
Our estuaries are an integral part of our environment and economy and provide unique ecosystems for many varieties of fish, shellfish, aquatic plants and animals. Bushfires and extreme weather conditions can drastically harm the ecosystem of an estuary. In order to manage our estuaries sustainably, there are several monitoring, evaluating and reporting programs run by the government with the support of local councils.
What happened?
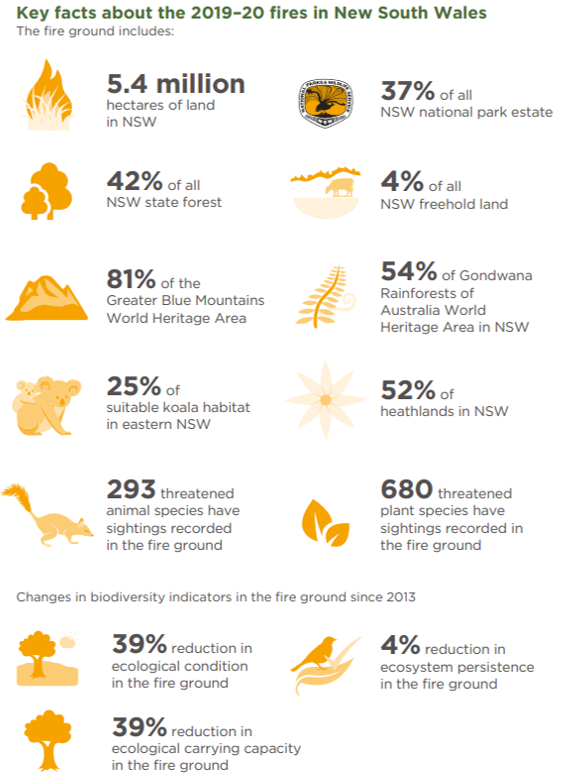
The intensity of 2019-2020 bushfire raises concerns around water quality due to loss of vegetation near waterways, soil erosion, falling ash and changes to water flows. Figure 1 (original here) shows the key facts about the 2019-2020 bushfires.
There are many factors that impact water quality, however one of the critical factors is massive runoff due to the heavy rain that fell immediately following the bushfires. This runoff carries soil, leaves, ash and other burnt organic debris into our water system.
The fallen leaves and branches of trees use up dissolved oxygen in the water system to break down over time. This might lead to animals in the water not having enough oxygen.
How do we know?
Analysis of the water quality during the bushfire season help us to plan how to manage the potential issues and raise awareness amongst the public. DPIE monitored the seven most affected catchments through fixed water quality monitors which record the values of physicochemical indicators such as temperature, conductivity, salinity and dissolved oxygen. The logged monitor data is available here, and it is accessible for the public.
The seven estuaries monitored in 2019-2020 are:
- Bellinger River (Mid north coast)
- Khappinghat Creek (Mid north coast)
- Lake Conjola (South Coast)
- Termeil Lake (South Coast)
- Meroo Lake (South Coast)
- Tuross River (South Coast)
- Wonboyn River (South Coast)
Dissolved Oxygen trend
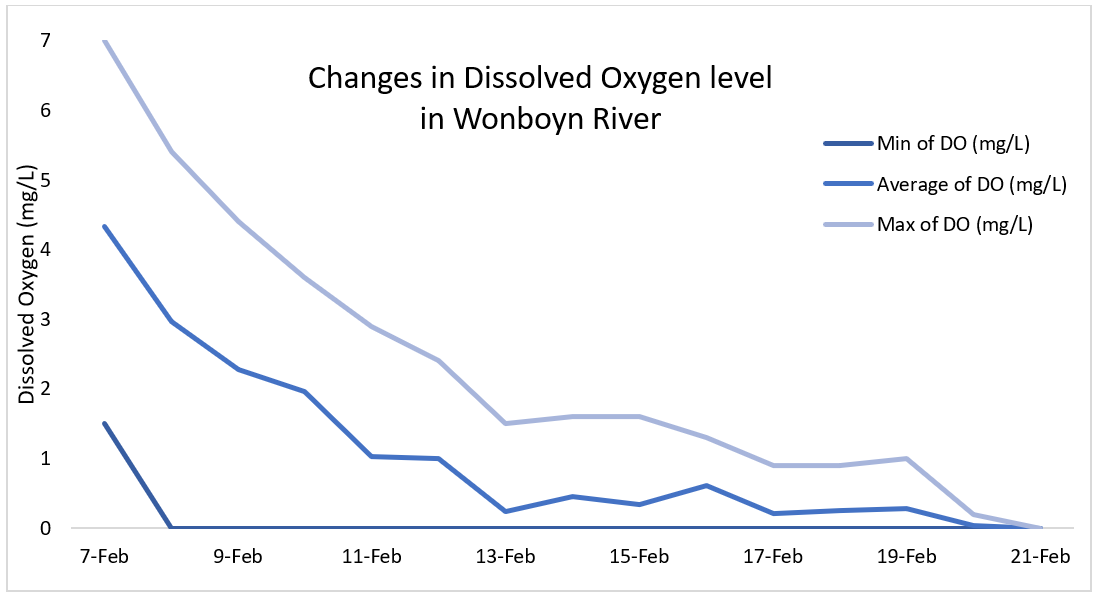
The graph shows the changes in dissolved oxygen (DO) level in Wonboyn River, Logger ID WBN4-Bottom. The log period is from 7th Feb 2020 to 26th Feb 2020, with an average temperature of 22.74°C. The graph shows that the average Dissolved Oxygen level is falling from 4.3 mg/L to 0 mg/L over the log period.
In this region, bushfire activity was high during January 2020. Bureau of Meteorology data shows that by the 13th Feb 2020, the entire bushfire season had come to an end with widespread rain. Runoff to the Wonboyn River since early February 2020 contained a lot of organic material and as it decomposed it used up oxygen dissolved in the water. The low dissolved oxygen is a threat to aquatic life.
What do we do with data?
It is vital to get reliable data from sources such as water quality loggers over a period to assess physicochemical indicators of the water quality in our estuaries. Access to such reliable data helps communities to develop their ongoing strategies and future planning. Academics also use the freely available data for their research and analysis, which helps to derive new insights to protect human health and the environment.
Bushfire monitoring and research was funded through the NSW Marine Estate Management Strategy. The environmental-related data is accessible through DPIE’s SEED Portal and searchable via Data.NSW. If you are interested in the environment and related data, please visit Data.NSW.
More data and information on NSW estuaries can be found at https://www.environment.nsw.gov.au/topics/water/estuaries.